The Spark Selects series features a monthly article from one of our team members.
To nurture creativity in Spark, we encourage our team to discuss their desired topics and interests. The views expressed here are strictly those of the writers and not of Spark. If you are interested in our B2B content, head on over to our Spark's Voice Blog, and if you are a startup founder looking for some inspirational and educational reading, check out our Startup Series.
Grab your walking shoes. Get some water. Today, we’re going on a mind hike to explore the internals of a predictive model.
We’ll start by following model boundaries to understand its context. Then the hike will ramp up on the model definition path, followed by a viewpoint of a model combination. We will finish with an example and a summary of the main points.
Speaking about hiking and directions, try to imagine a hiking map right now. Road lines everywhere, rivers and sea in blue, legend in the corner outlining what every little icon means…
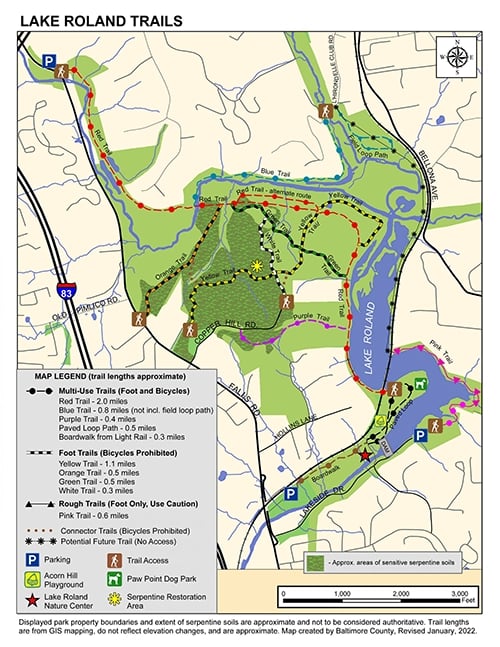 A map is a representation of a part of the physical world. A map is a model. It is even a predictive model, one used to get directions.
But it’s not a representation of the full world, just a small part of it. Imagine estimating the distance from your position to the nearest bridge on a world map. That’s impossible, it’s just not detailed enough. The map covers a large space but has few details. And a local map has the reverse issue. Also, if too much information is put on the map, think satellite + all roads name merged, the map becomes unreadable. Atlases solve the details level issue by offering plenty of maps, each limited both in terms of geographic space and in terms of what and how much is represented.
Every map has a context: what is represented, how, and for what purpose. Knowing that context allows you to read the map better. See the blue on the map? You understand blue represents bodies of water even before checking the legend. Yet, one look at Dublin Bay is enough to know the pastel blue of the map is not a very accurate depiction of the colour of the water.
Recognition occurs because you have read other maps and because colour fills mean area, and area in a geographical context means some sort of land type or biome. And the bluest, most common biome is water bodies.
In short, the context contains a lot of hidden, implicit information about the model.
Let’s take a closer look at the legend. See the icon 🅿? This icon is also a partial representation of the world. It is also a model. This icon appears close to the word “parking” in the legend. The word “parking” is also a model. Both the icon and the word refer to a place where to leave a car.
The definition “a place where to leave a car” is also a model; it refers to the same thing as the icon and the word. The three models may be used in different settings, but their meanings are equivalent. The definition is the most explicit one. And you can add to it, even context information, until you are sure no ambiguity is left.
Still on the legend? There are plenty of different icons, lines, colours and words, each of them a model. Their combination makes the map model.
Let’s get a practical example: “To get to the nearest bakery, go in that direction, turn right at the bus stop, go to the end of the street, then turn left. The bakery is 50m away, on the right side of the street”. This is the definition of a path. One that can be represented into a map, or at least a scribble on a post-it, a simple map limited to that path.
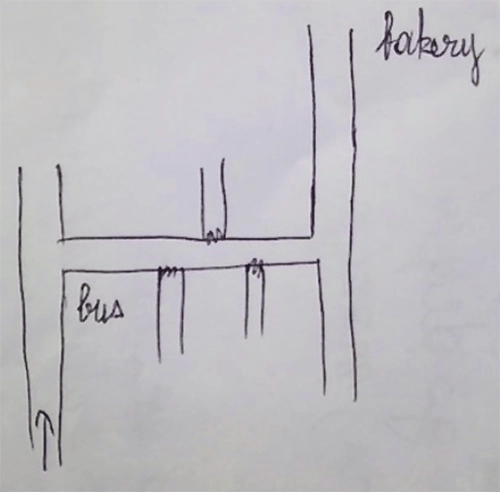
There are 3 main models components there:
- The lines for the streets
- The arrow for starting point
- The words for reference points
There are also a few other implicit ones that are linked to the scribbling context, like
- “The distances are approximative.”
- “There are plenty of other reference points that are not on the scribble.”
- “Ignore the little wavy stuff, I forgot the side roads at the first pass.”
Remove the lines, the arrow, or the words; the scribble is not equivalent to the path definition anymore and is pretty much unreadable. Their combination makes the map model.
Maps are good and all, but what about the maths models? Are the fancy formulae full of greek letters and esoteric symbols? Like p=2πr? Models, themselves a combination of models with limits, context and definitions. The symbols are the equivalent of the little map icons. Mathematicians use symbols instead of their full definitions because they don’t want to write a novel every time they calculate the perimeter of a circle.
It is just that instead of representing roads or landmarks, the symbols and maths words are representing concepts. In a geometry context, p, the perimeter, is the length of a shape border; r, the radius, is the distance between the centre and the border of a circle; = marks equivalence between two values; π is a special number in maths that appears often enough to gain its own name, like a mountain that is a familiar reference point in a landscape.
To better understand one particular model, it is worth having a look at:
- Limits: What does the model represent? What information is excluded from that model?
- Context: What is the model's purpose? How has it been created? What are the implicit parts of the model?
- Definition: A good test of model understanding is to try to express what the model is with your own words or own schema
- Components: What are the model components? Is the model a component of a bigger model? Are you able to define each component, including the implicit ones?
Now that you have a good grasp of what makes a model, our next step is to build one.